Apple Inc. (AAPL) (AAPL) Dividend Investment Analysis
A Strategic Architect Choosing Platform Dominance Over Direct AI Infrastructure Investment
🏢 A. Business Overview (What They Do)
While big tech competitors spend billions on AI infrastructure, Apple is positioning itself as a ‘Strategic Editor’ integrating AI into the user experience (UX). Despite legal risks from the Epic Games lawsuit and Siri settlements, strong demand for Macs and high growth in the Services sector are compensating. A key watchpoint is Apple’s dominance in the on-device AI market, powered by its proprietary M-series silicon.
📉 B. Price Trend & Key Metrics
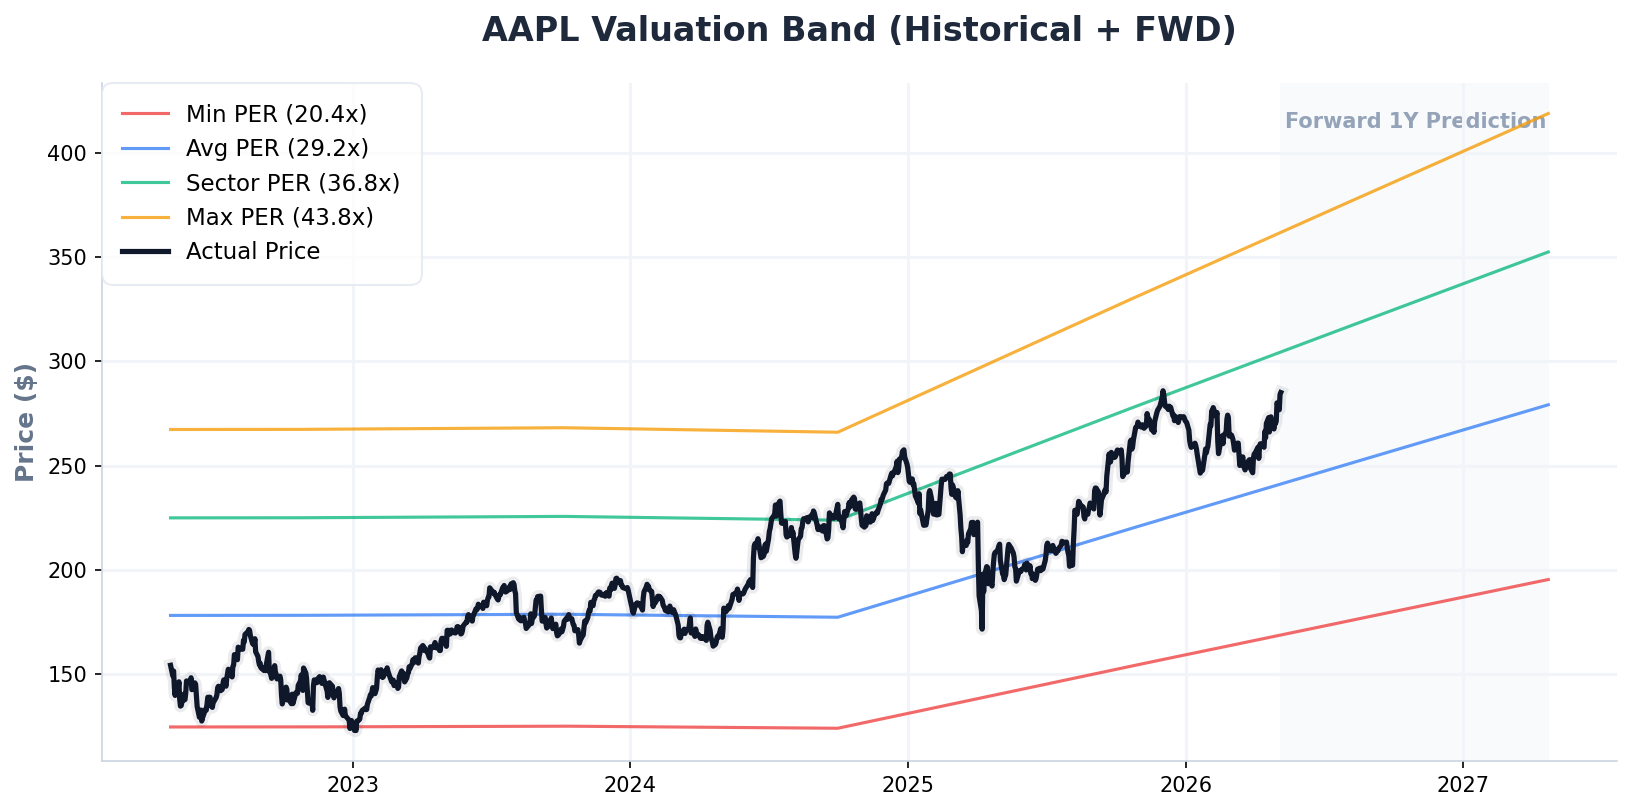
(AAPL Historical 5-Year + 1-Year Forward P/E Valuation Band)
💎 C. Dividend Foundation (Dividend Data)
💡 PLAN B’s Dividend Strength Assessment
Apple’s 0.38% dividend yield may seem low, but this is a relative figure driven by stock price appreciation. With 22 consecutive years of dividend growth and a payout ratio of only 12.6% of earnings and 15.3% of FCF, dividend safety remains top-tier. Considering total shareholder returns including buybacks, its appeal as a dividend growth stock remains intact desipte dividned growth rate (CAGR) is only approx. 4~5%.
📊 D. Key Fundamentals (TTM Basis)
📈 E. Earnings Momentum & Dividend Sustainability
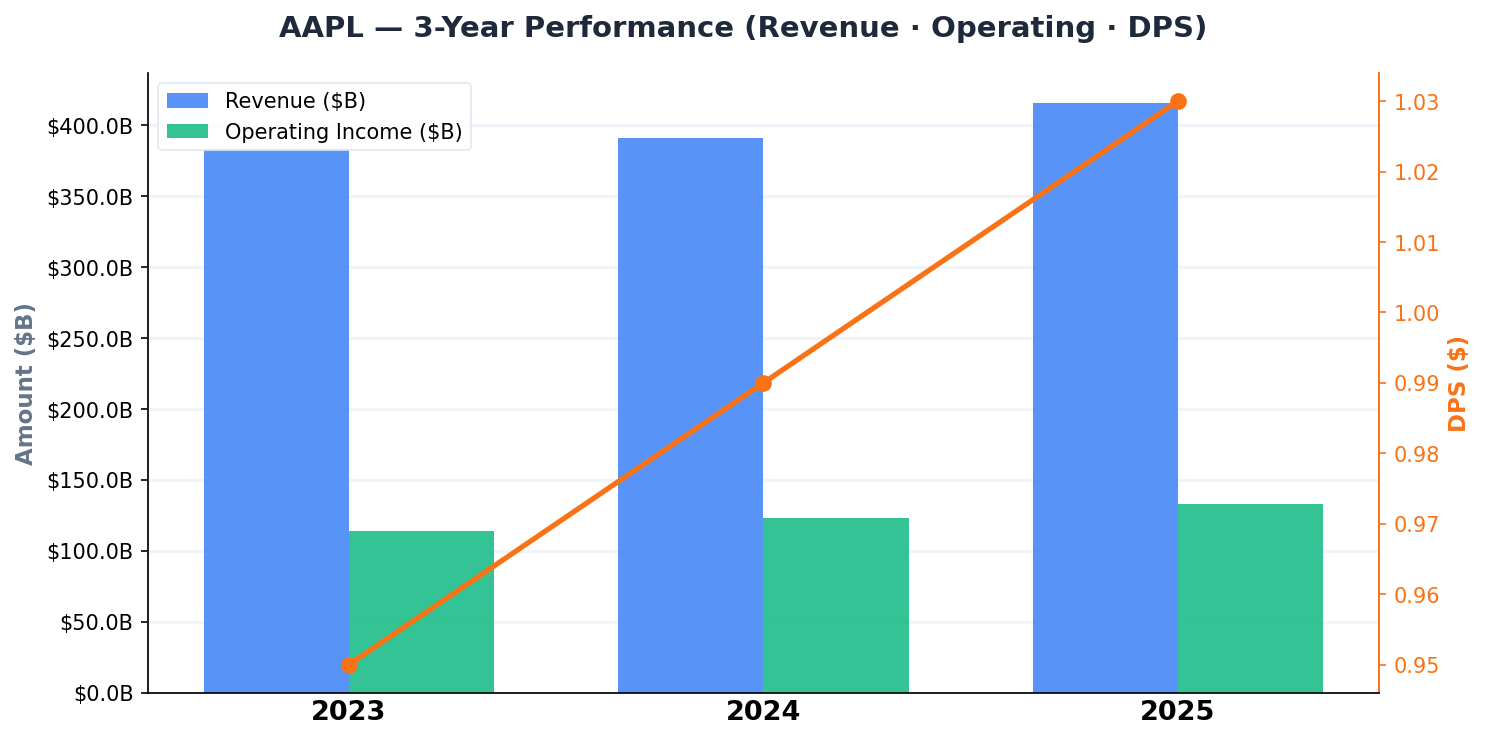
(AAPL 3-Year Revenue, Operating Income & DPS Trend)
Quarterly net income surged 53.27% QoQ, signaling strong momentum, though this likely includes one-time gains or seasonal factors. However, an exceptional 32.27% operating margin and the ability to generate over $100 billion in annual FCF are unparalleled. The stock is currently undergoing consolidation near its recent highs.
⚖️ F. Fair Value Calculation
🔍 6-Way Valuation Checklist
| Valuation Model | Fair Value Est. | Core Logic |
|---|---|---|
| [M1] P/E Ensemble | $257.63 | Market(27.5) / Sector(36.8) / Historical(29.2) P/E 3-Way Ensemble |
| [M2] P/FCF Cash Flow | 278.28 | Applied sector average P/FCF multiple (0.9x adjustment) |
| [M3] Dividend Yield Theory | $211.76 | Reverse-engineered from Historical Avg. Yield (0.51%) — Core Dividend Model |
| [M4] Historical P/FCF Multiple | $244.94 | Applied historical P/FCF multiple for the stock |
| [M5] Wall Street Consensus | $303.38 | Institutional analyst 12-month price target average |
| [M6] Dynamic DCF | 150.55 | Cash flow-based Gordon Growth Model (WACC: 9.7%, g: 5.0% [earningsGrowth]) |
📌 Sector-Specific Valuation Notes
Applied dynamic Winsorization to one historical P/E outlier (Original Avg: 29.4x → Adjusted: 29.2x, Dynamic Range: [10.0x, 33.0x])
PLANB INSIGHT Deep-Dive Valuation Analysis & Adjustment Rationale
Our AI-driven system calculates Apple’s fair value at $241.09, suggesting the current price of $285.07 is approximately 15.4% overvalued. Even applying a conservative 0.9x multiple ($278.28) relative to the sector average P/FCF (36.8x), the margin of safety is insufficient. A Gordon Growth Model using a 9.68% WACC and 5.0% growth rate (g) confirms that current aggressive valuations (34.5x P/E) exceed the historical average (29.2x). We maintain a buy-on-dips stance.
⚠️ This post is a personal investment study and does not constitute investment advice or a recommendation to buy or sell any security.
All investment decisions and their consequences are solely the responsibility of the individual investor. Please conduct thorough due diligence and consult a professional before investing.