
Nexstar Media Group, Inc. (NXST) Dividend Investment Analysis
A dominant local broadcasting giant with an aggressive dividend growth engine
🏢 A. Business Overview (What They Do)
Nexstar Media Group (NXST) is the largest local television station operator in the United States, owning or operating 200 stations in 116 markets. Its business model relies on highly stable retransmission consent fees and advertising revenue. Recently, the market sentiment has been dampened by a federal court’s temporary halt of the $6.2 billion Tegna merger. However, Nexstar’s core operations remain exceptionally robust, continuing to generate massive free cash flow despite the regulatory noise.
📉 B. Price Trend & Key Metrics
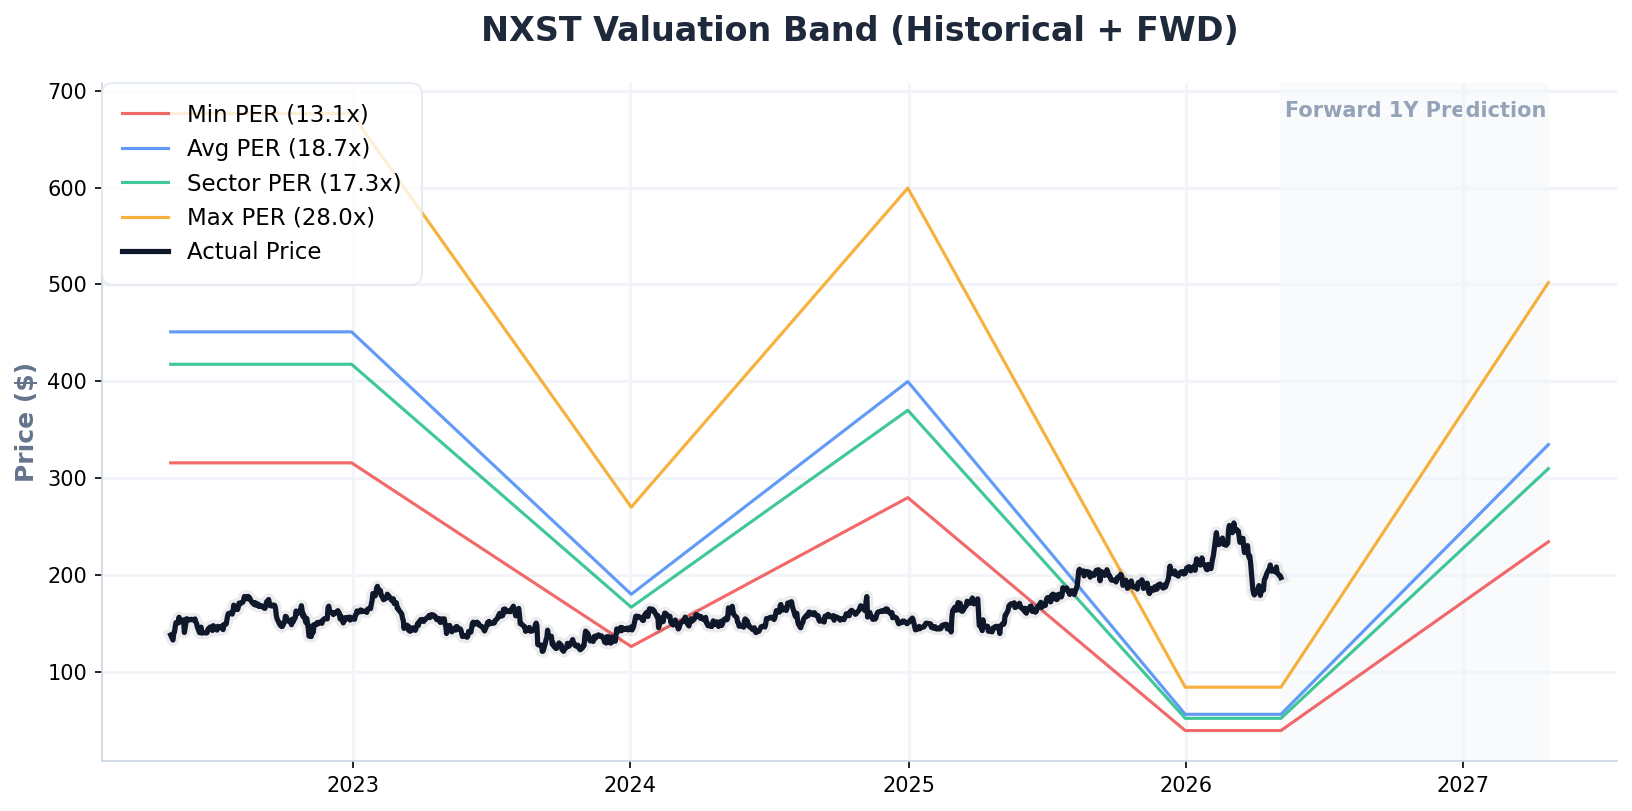
(NXST Historical 5-Year + 1-Year Forward P/E Valuation Band)
💎 C. Dividend Foundation (Dividend Data)
💡 PLAN B’s Dividend Strength Assessment
Nexstar is a dividend growth powerhouse, boasting a remarkable 5-year CAGR of 27.13%. With a dividend yield of 3.77% and a conservative FCF payout ratio of approximately 24%, the dividend is not only safe but has significant room for future double-digit increases. For FIRE investors, NXST represents a high-velocity ‘dividend fountain’.
📊 D. Key Fundamentals (TTM Basis)
📈 E. Earnings Momentum & Dividend Sustainability
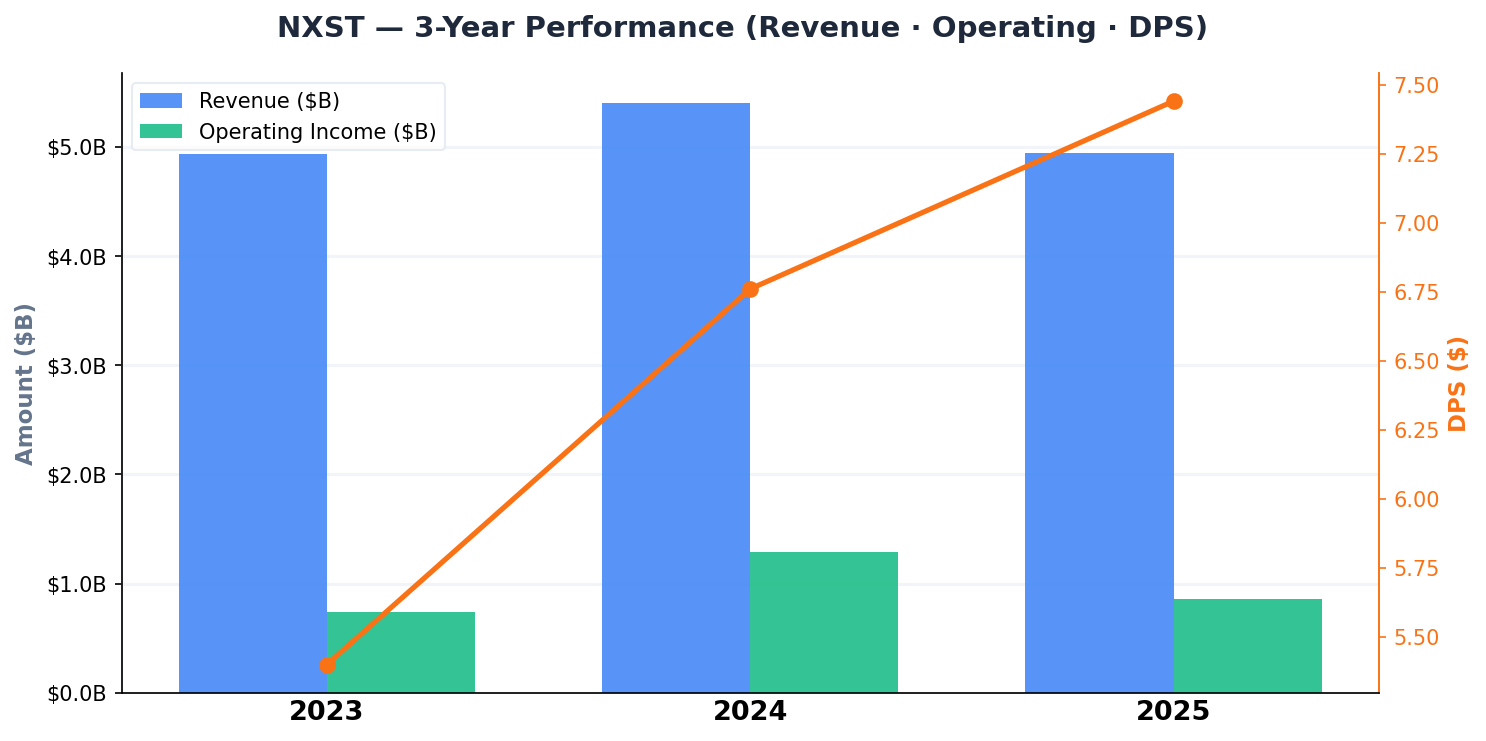
(NXST 3-Year Revenue, Operating Income & DPS Trend)
While the TTM EPS ($3.0) appears weak, this is primarily due to one-time accounting noise (likely related to merger-related expenses or legal settlements). The Forward EPS of $17.92 paints a much more accurate picture of the company’s earning power. The underlying operational momentum remains strong, supported by dominant market share in local broadcasting.
⚖️ F. Fair Value Calculation
🔍 6-Way Valuation Checklist
| Valuation Model | Fair Value Est. | Core Logic |
|---|---|---|
| [M1] P/E Ensemble | $379.43 | Market(27.6) / Sector(17.3) / Historical(18.7) P/E 3-Way Ensemble |
| [M2] P/FCF Cash Flow | $378.42 | Applied sector average P/FCF multiple (0.9x adjustment) |
| [M3] Dividend Yield Theory | $254.79 | Reverse-engineered from Historical Avg. Yield (2.92%) — Core Dividend Model |
| [M4] Historical P/FCF Multiple | $454.18 | Applied historical P/FCF multiple for the stock |
| [M5] Wall Street Consensus | $258.75 | Institutional analyst 12-month price target average |
| [M6] Dynamic DCF | $328.11 | Cash flow-based Gordon Growth Model (WACC: 9.1%, g: 3.0% [default]) |
📌 Sector-Specific Valuation Notes
TTM EPS(3.0)가 Forward EPS(17.92) 대비 30% 이상 급락 — 일시적 노이즈(일회성 손실) 판단, Forward EPS(17.92)로 M1 밸류에이션 수행 | 역사적 PER 이상치 2건 동적 보정(Winsorization) 적용 (원본 평균 21.8x → 보정 후 18.7x, 동적 범위 [6.6x, 45.4x])
PLANB INSIGHT Deep-Dive Valuation Analysis & Adjustment Rationale
Our ensemble valuation model (M1-M6) yields a fair price of $342.28, representing a massive 73.56% margin of safety from the current price of $197.21. We specifically normalized the M1 (Relative Value) model using Forward EPS ($17.92) instead of the distorted TTM EPS. The combination of historical yield reversion (M3) and robust Gordon Growth Model (M6) projections confirms that NXST is currently trading deep in ‘Strong Buy’ territory.
⚠️ This post is a personal investment study and does not constitute investment advice or a recommendation to buy or sell any security.
All investment decisions and their consequences are solely the responsibility of the individual investor. Please conduct thorough due diligence and consult a professional before investing.