
When I opened the file ahead of getting my May ledger revealed, even I paused for a moment. 8.97 million KRW. The number itself is a fact. At first, I read it just like that. 8.97 million KRW — is this just my monthly spending? But it wasn’t. As I started opening up the items one by one, the structure that created this number began to appear. Depending on how you read the same data, a completely different picture emerges.
💡 Plan B Insight: The Core of This Post
Thanks to the automation system built in Part 2, 5 months of data from January to May have been created. This part is the first time laying out all that data. It records the process of dissecting the true identity of the 8.97 million KRW figure, and deriving the actual required monthly amount of 5.19 million KRW from within it. This is what it means to have choices once the numbers become visible.
1. May Ledger Revealed — Full Breakdown of May 2026
I won’t sugarcoat it. I’m just uploading everything.
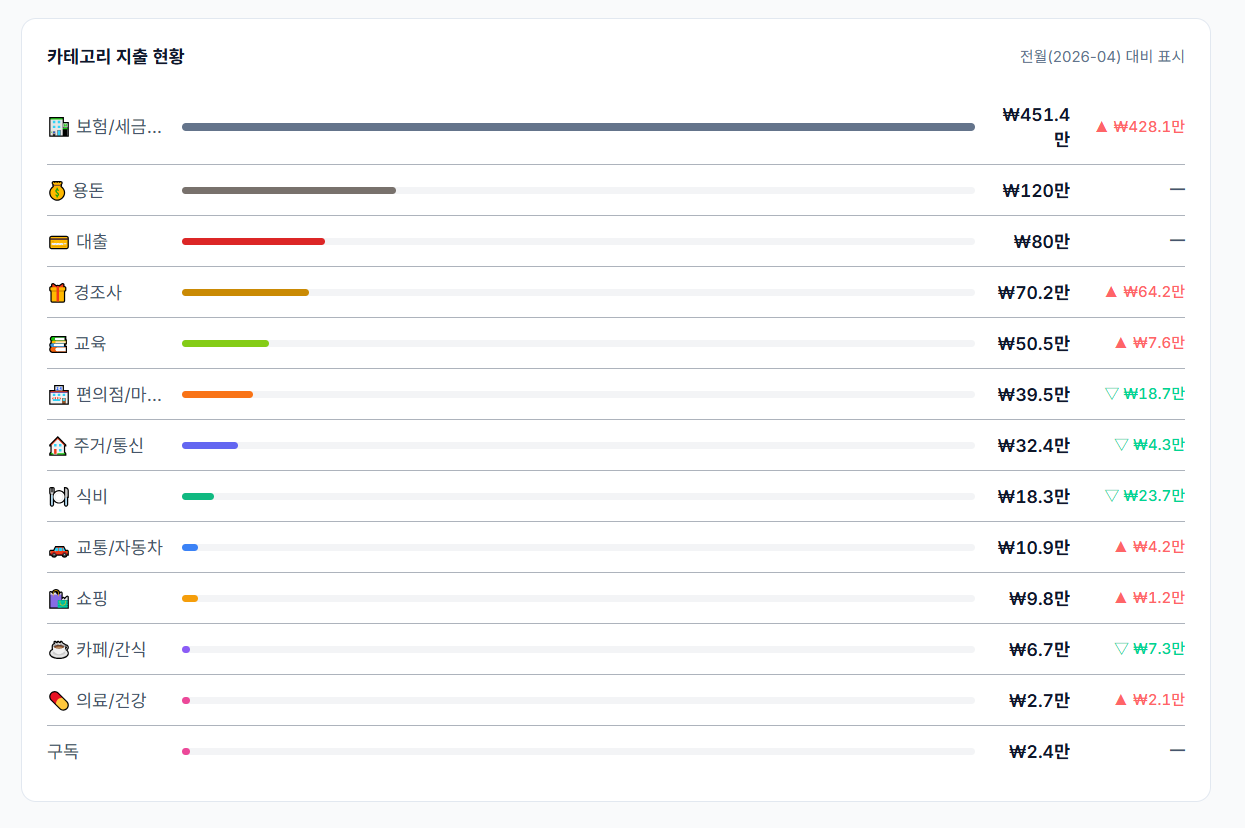
| Category | Amount | Note |
|---|---|---|
| Insurance/Tax/Finance | 4.51M KRW | ⚠️ Core of this month |
| Pocket Money | 1.20M KRW | Fixed |
| Loan Repayment | 800K KRW | Fixed |
| Congratulatory/Condolence | 579K KRW | Irregular |
| Education | 505K KRW | |
| Dining | 397K KRW | |
| Convenience/Mart/Goods | 395K KRW | |
| Housing/Telecom | 324K KRW | |
| Transport/Car | 109K KRW | |
| Cafe/Snack | 53K KRW | |
| Shopping | 51K KRW | |
| Medical/Health | 27K KRW | |
| Subscriptions | 24K KRW | |
| Total | 8.97M KRW |
Looking at this table, your eyes naturally gravitate to one place. Insurance/Tax/Finance at 4.51 million KRW — which is 3.7 times larger than the second place, Pocket Money (1.20M KRW). Half of the total sum is concentrated in this single category.
I looked into the items one by one.
2. The Identity of 4.51M KRW — Taxes Clustered in This Month
Comparing it right away with the January-April average of the same category makes it clear.
Jan-Apr Insurance/Tax/Finance Monthly Avg: 346K KRW (Fixed monthly items like insurance premiums) May Insurance/Tax/Finance: 4.51M KRW Difference: 4.16M KRW
This 4.16 million KRW difference represents the additional comprehensive income tax and US stock capital gains tax paid this month.
Structure of Insurance/Tax/Finance 4.51M KRW
Of course, the 4.51 million KRW that goes out all at once like this time’s comprehensive tax or US stock tax is immediately recognizable. But there are things you can’t easily see without data. How many more congratulatory/condolence expenses overlapped this month, whether food expenses spiked for a specific reason, which category is slowly creeping up — these are things you can only see when you look at the structure. The extreme cases simply show the principle well.
3. The 3-Layer Structure of Spending — Dissecting the 8.97M KRW
If you divide the 8.97 million KRW into 3 layers, a completely different picture emerges.
You can’t touch Layer 1 right away. Unless loan repayment ends or your life structure changes, it goes out as is.
Layer 2 has the highest analysis value. Dining 397K KRW, Convenience/Mart 395K KRW, Transport 109K KRW — my habits and choices are stamped here.
Layer 3 shouldn’t be read monthly. It’s not “I spent 580K on congratulations this month,” but rather setting an annual budget and viewing it distributed over time.
4. What is the Real Monthly Spending? — Tax Adjustment Calculation
If you just look at the simple 5-month average:
| Month | Spending Amount | Note |
|---|---|---|
| Jan | 4.48M KRW | |
| Feb | 5.74M KRW | Included Lunar New Year |
| Mar | 4.73M KRW | |
| Apr | 4.41M KRW | |
| May | 8.97M KRW | ⚠️ Taxes 4.17M concentrated |
| 5-Month Simple Avg | 5.67M KRW | Taxes overestimated |
5.67 million KRW. Using this as “my average monthly spending” would be wrong. Because an annual tax fell within these 5 months, pulling the average up. The correct processing involves two steps — removing the tax from the 5-month total to get pure living expenses, and then dividing the annual tax by 12 months to reflect it back into the monthly budget.
Tax Adjustment Calculation — 2 Steps
STEP 1 — Calculate Pure Living Expenses
STEP 2 — Reflect Annualized Tax
Verification: Jan-Apr pure living expense avg 4.84M KRW → Matches STEP 1
5.19M KRW — This is the actual required monthly amount reflecting annualized taxes.
It’s not simply subtracting the tax and ending it there. Just because 4.17 million KRW went out all at once in May doesn’t mean this money disappears — it’s money you have to pay every year anyway. The 5.19 million KRW is the pure living expense plus the 347K KRW obtained by dividing the annual 4.16 million KRW tax by 12 months. In reality, this is structured so you save this amount in a tax reserve account every month and use it at the payment point in May.
Based on pure living expenses (excluding taxes), the January-April average is 4.84 million KRW — almost perfectly matching the STEP 1 figure, confirming the reliability of the intermediate calculation.
5. The Questions That Change When Numbers Appear
Without the data of my May ledger revealed, these questions themselves would be impossible.
INSIGHT When Numbers Show Up, Choices Arise
Pocket Money 1.2M KRW: Is this an appropriate level? → I have to look inside the item to judge.
Loan 800K KRW: When the repayment schedule ends, fixed expenses drop by 800K KRW → Can be reflected in FIRE timing calculation.
Congratulatory/Condolence 579K KRW: How many events were there this month? → I have to divide by the annual average to see the actual burden level.
Dining 397K KRW vs Jan-Apr Avg 236K KRW: Did I eat out exceptionally often in May? Order a lot of delivery?
These questions became possible thanks to the system built in Part 2. Things that previously would have ended with “I think I spent a lot this month,” can now be dissected by item and amount. Even with the same data, seeing the structure leads to a completely different conversation.
A baseline of 5.19 million KRW has been established. Only now is the next question possible — So what is my passive income? Where does my FIRE journey stand right now?
⚠️ This post shares personal spending management experiences and does not recommend specific investments or financial decisions. Please make judgments fitting your situation or consult an expert.
Series — Designing the Flow of Money
Part 1
Why Receiving 4.5M KRW a Month in Dividends Still Makes FIRE Scary
Part 2
How a Single Receipt Automatically Becomes a Ledger
Part 3 · Current Post
May Ledger Revealed: I Spent 8.97M KRW
Part 4
Where Does My FIRE Journey Stand Right Now?