Verizon Communications (VZ) Dividend Investment Analysis
U.S. Telecom Infrastructure Leader with 24 Years of Consecutive Dividend Growth — A Core Candidate for Value Large-Cap Investing
🏢 A. Business Overview (What They Do)
📉 B. Stock Price & Basic Check
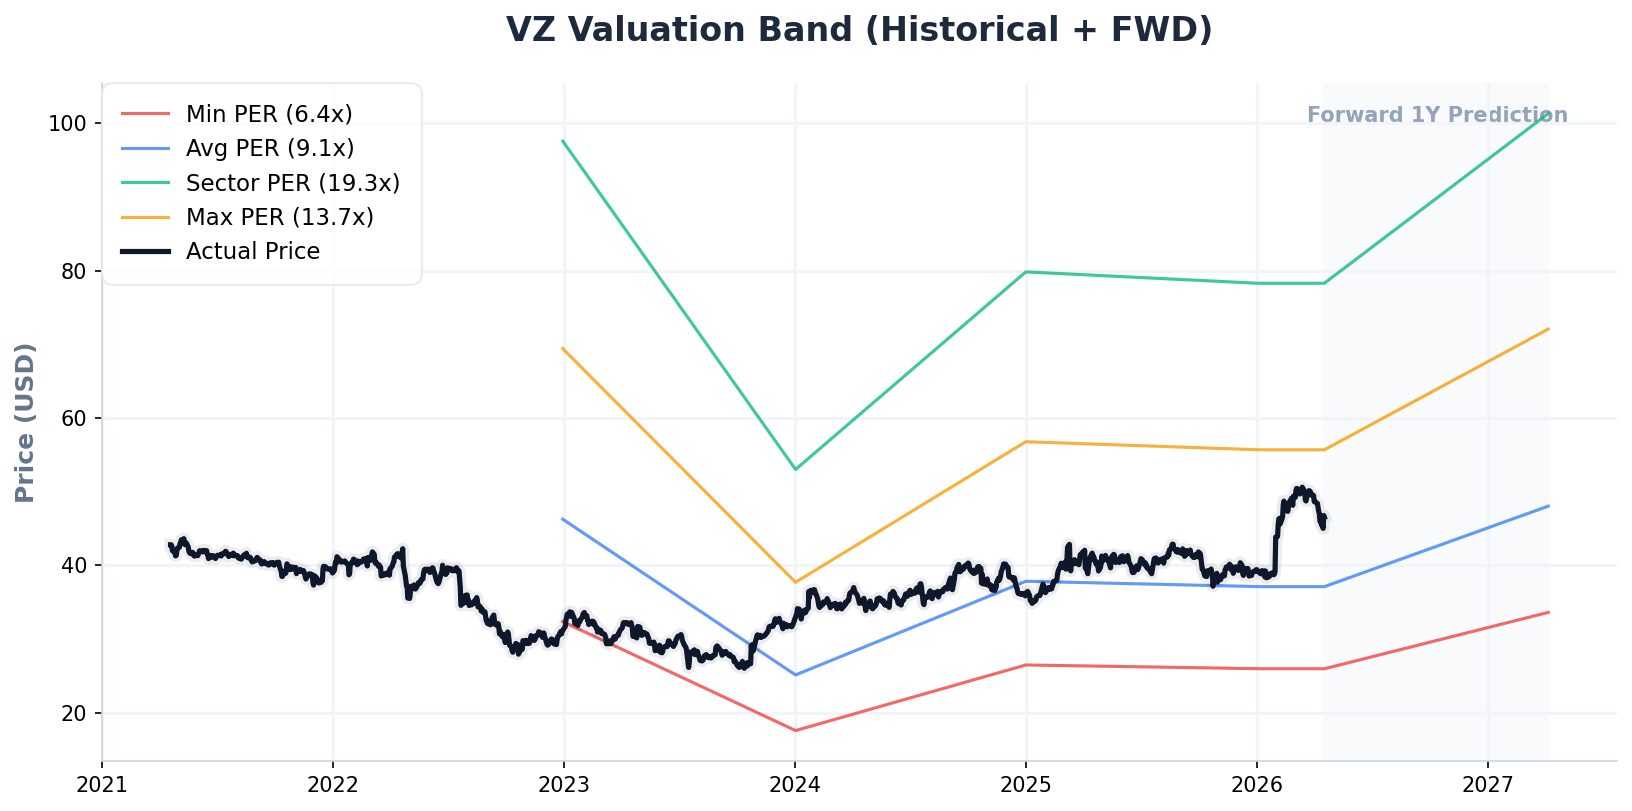
(VZ 5-Year Historical + 1-Year Forward P/E Valuation Band)
💎 C. Dividend Fundamentals
💡 PLAN B’s Dividend Health Diagnosis
Verizon’s forward dividend yield of 6.08% is significantly higher than the average for large-cap U.S. stocks (1.5~2%), and most importantly, the company boasts a consistent history of 24 consecutive years of dividend increases, which is a major strength. A 5-year dividend growth rate of 1.95% falls short of fully offsetting inflation (approximately 2.5%), but when considering stable cash flows and low credit risk (characteristic of telecommunications infrastructure companies with high profitability), it remains highly attractive as an inflation-hedge position for FIRE investors. The dividend payout ratio of around 50% represents a healthy balance between supporting additional growth investments and continuing dividend increases.
📊 D. Key Fundamentals (TTM)
📈 E. Earnings Momentum & Dividend Sustainability
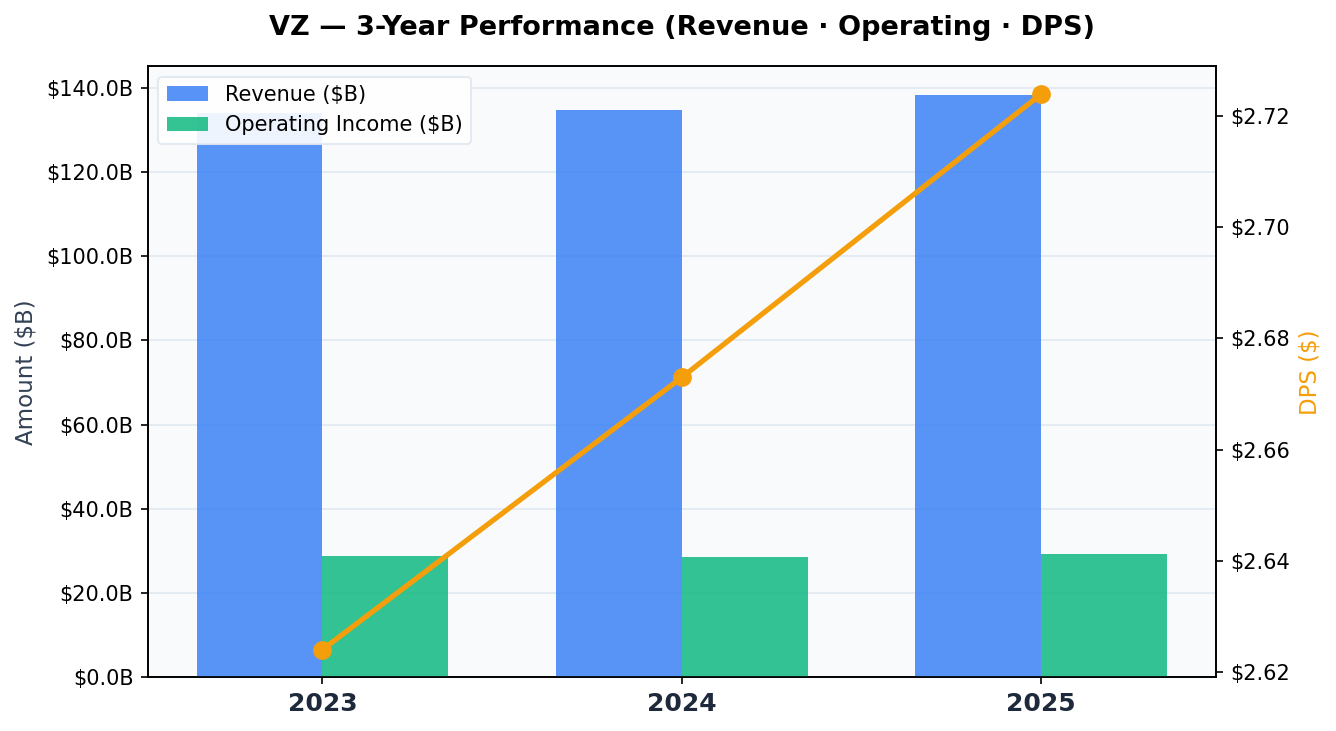
(VZ 3-Year Revenue, Operating Income & DPS Trend)
⚖️ F. Fair Value Calculation
🔍 6-Way Valuation Checklist
| Valuation Method | Fair Value | Key Logic |
|---|---|---|
| [M1] P/E Ensemble | $73.92 | Ensemble of three P/E multiples: Market ($28.16x) / Sector ($15x) / Historical ($11.47x) |
| [M2] P/FCF Sector | $63.50 | FCF per share $4.71 × sector average P/FCF 12x × 0.9 discount |
| [M3] Dividend Yield | $80.86 | Back-calculation from historical average dividend yield (3.5%) — core model for dividend investors |
| [M4] P/FCF Historical Multiple | $54.10 | FCF per share $4.71 × historical average P/FCF multiple 11.5x |
| [M5] Market Consensus (Wall Street) | $51.58 | Average 1-year target price from institutional analysts (Target Mean) |
| [M6] Dynamic DCF | $67.39 | Absolute value model based on FCF (5-year growth rate 3%, WACC 7%) |
💡 PLAN B’s Valuation Diagnosis
Verizon’s six valuation models yield a range from $51.58 (consensus) to $80.86 (dividend yield), and the equal-weighted average across all models produces a fair value of $69.62. The current price of $46.55 represents a 33% discount to fair value, positioning it as an exceptionally favorable entry point for FIRE investors pursuing long-term dividend income goals. Notably, M3 (dividend yield model, $80.86) reflects the perspective of dividend-focused investors based on historical yield patterns, while M5 (analyst consensus, $51.58) represents a conservative yet realistic market expectation. The current price sitting precisely between these two models suggests the market is valuing VZ fairly at face value but underappreciating its long-term dividend growth potential. With 50%+ upside potential over a 6-12 month horizon, this represents a compelling buy signal for FIRE-focused dividend investors.
⚠️ This post is written for personal investment study purposes and does not constitute a recommendation to invest in any specific stock.
All investment decisions and their consequences are solely the responsibility of the investor. Please conduct thorough due diligence and consult a financial professional before investing.