UnitedHealth Group (UNH) Dividend Investment Analysis
26 Years of Consecutive Dividend Growth: Is the Historic Dip in the Healthcare Giant a Buying Opportunity?
🏢 A. Business Overview (What They Do)
UnitedHealth Group (UNH) is the largest healthcare company in the U.S. by revenue, operating through two primary pillars. First is UnitedHealthcare — a core health insurance business covering individual/group plans, Medicare Advantage, and Medicaid. Second is Optum — a healthcare service platform encompassing Pharmacy Benefit Management (PBM), medical data analytics, and clinic operations, effectively integrating the entire healthcare ecosystem.
With a TTM revenue of $447.6B, it rivals giants like Apple and Amazon. While its Operating Margin sits at 4.24% due to the nature of Managed Care, its FCF generation remains robust at approximately $14B annually, providing a stable foundation for dividend growth and share buybacks. Recently, the stock has plummeted about 50% from its 52-week high ($606), driven by the CEO tragedy (Dec 2024), DOJ investigations into Medicare Advantage billing, and rising Medical Loss Ratio (MLR) concerns.
📉 B. Market Performance Summary
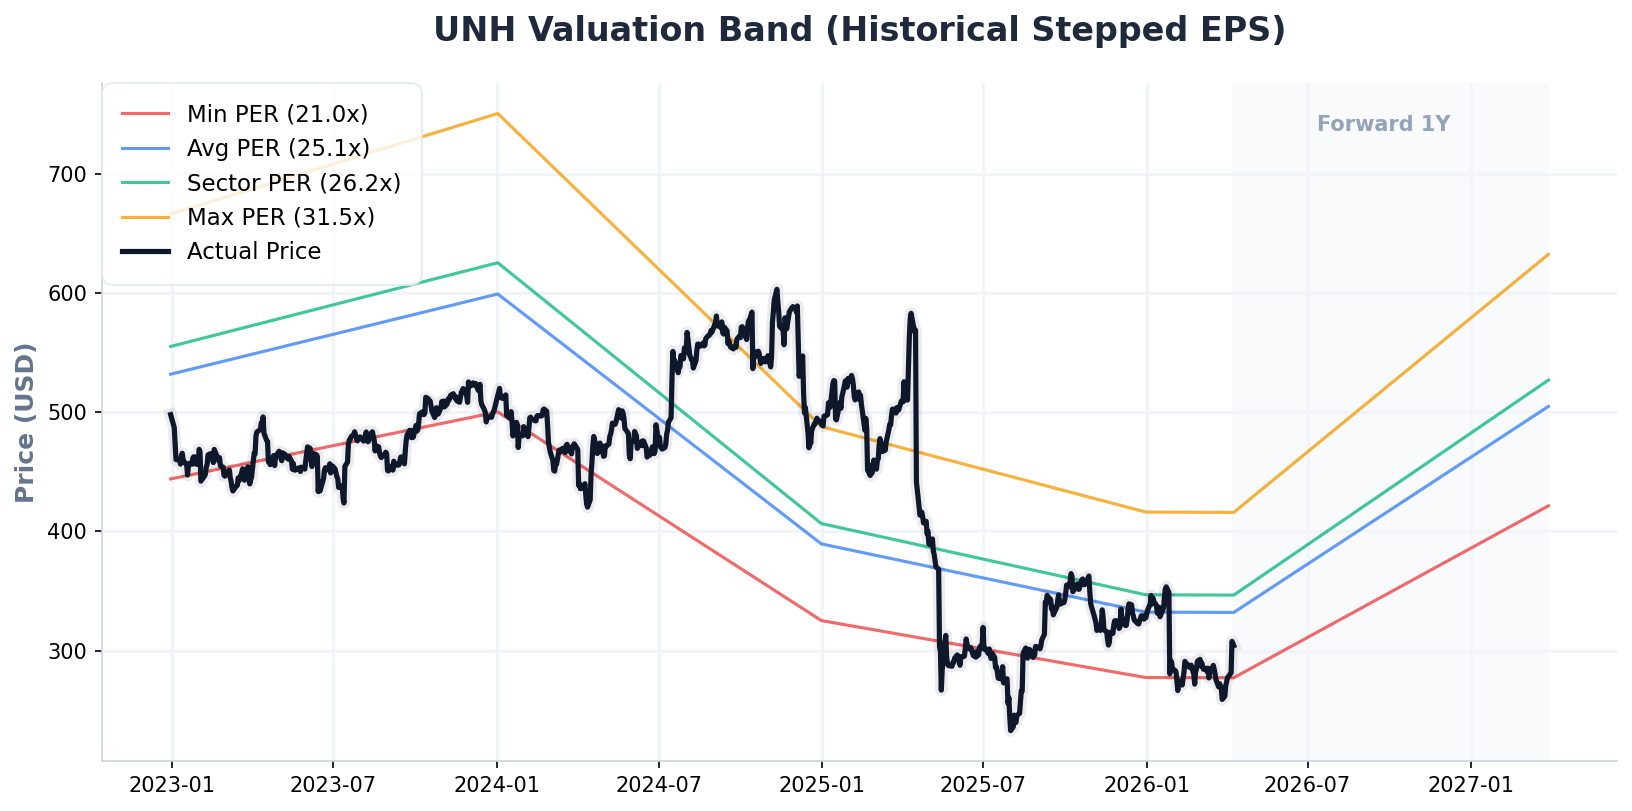
(UNH Historical 3-Year + 1-Year Forward P/E Valuation Band)
💎 C. Dividend Fundamentals
💡 PLAN B’s Dividend Health Assessment
The current dividend yield of 2.89% is at an all-time high for UNH, as the price correction has significantly enhanced yield attractiveness. Its Dividend Aristocrat status—marked by 26 years of uninterrupted growth—remains intact. With an FCF Payout Ratio of 57.1%, the company spends less than 60% of its cash flow on dividends, ensuring a high safety margin. For FIRE-oriented investors, this could be a rare entry point to lock in a ~3% yield with double-digit growth potential, provided current headwinds prove transitory.
📊 D. Key Fundamentals (TTM Basis)
📈 E. Earnings Momentum & Sustainability
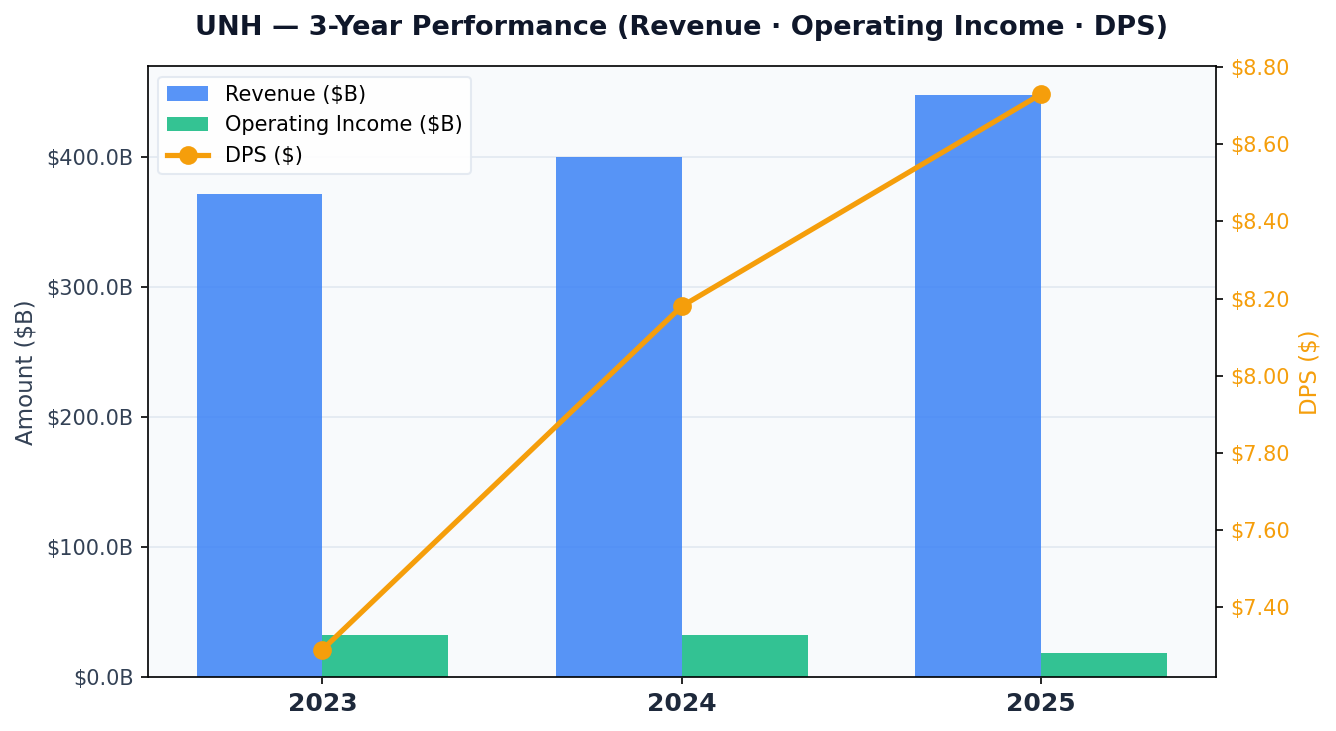
(UNH 3-Year Trend: Revenue, Operating Income, and DPS)
UNH’s TTM revenue ranks among the highest for private enterprises globally. Although an operating margin of 4.24% appears slim, it is offset by massive scale, yielding $18.96B in absolute operating profit. With Levered FCF at $13.86B against estimated dividend payments of $7.9B, there is sufficient “cushion” to maintain dividends even if earnings fluctuate by 10-20%. While Optum’s steady growth continues to anchor the company, the resilience of management’s dividend commitment remains the strongest investment thesis.
⚖️ F. Fair Price Calculation (Valuation)
🔍 Multi-Model Valuation Matrix
| Method | Intrinsic Value | Key Logic |
|---|---|---|
| [M1] 3-Way P/E Ensemble | $348.56 | Market(~22x) / Sector(26.4x) / Historical(25.1x) blend |
| [M2] Cash Flow (P/FCF) | $545.47 | Based on Healthcare Sector P/FCF of 30.8x |
| [M3] Dividend Yield Theory | $549.07 | 5Y Avg. Yield + Dividend Growth Mean |
| [M5] Wall Street Consensus | $360.62 | Institutional Analyst 12-Month Target Mean |
| [M6] DCF Intrinsic Value | $167.94 | Reflecting FCF CAGR of -11.8% (Conservative Scenario) |
💡 PLAN B’s Valuation Insight
By blending relative valuation models (P/E, P/FCF, Dividend Theory) with a weighted DCF, we arrive at a Fair Value of $348.98. Currently trading at $305.98, the stock is at a 12.3% discount, triggering a Buy Signal. However, the DCF model ($167.94) acts as a warning, reflecting the recent -11.8% FCF CAGR due to structural cost pressures. While the multiple-based valuation suggests a clear undervaluation, monitoring FCF recovery is critical. Recommendation: Staggered entry (DCA), with aggressive accumulation below $280.
⚠️ This analysis is for informational and educational purposes only and does not constitute financial advice.
All investment decisions and resulting responsibilities lie with the investor. Please consult a professional before investing.