
Merck & Co., Inc. (MRK) Dividend Investment Analysis
A must-hold for FIRE investors: Keytruda’s dominant market position meets a rock-solid dividend growth track record.
🏢 A. Business Overview (What They Do)
Merck is a pharmaceutical giant generating enormous cash flows through Keytruda, its unrivaled blockbuster in the global immuno-oncology market. The company is securing future growth engines through aggressive pipeline expansion and the high profitability of its Animal Health division, while proactively managing patent-expiry risk to maintain a powerful competitive moat within the healthcare sector.
📉 B. Price Trend & Key Metrics
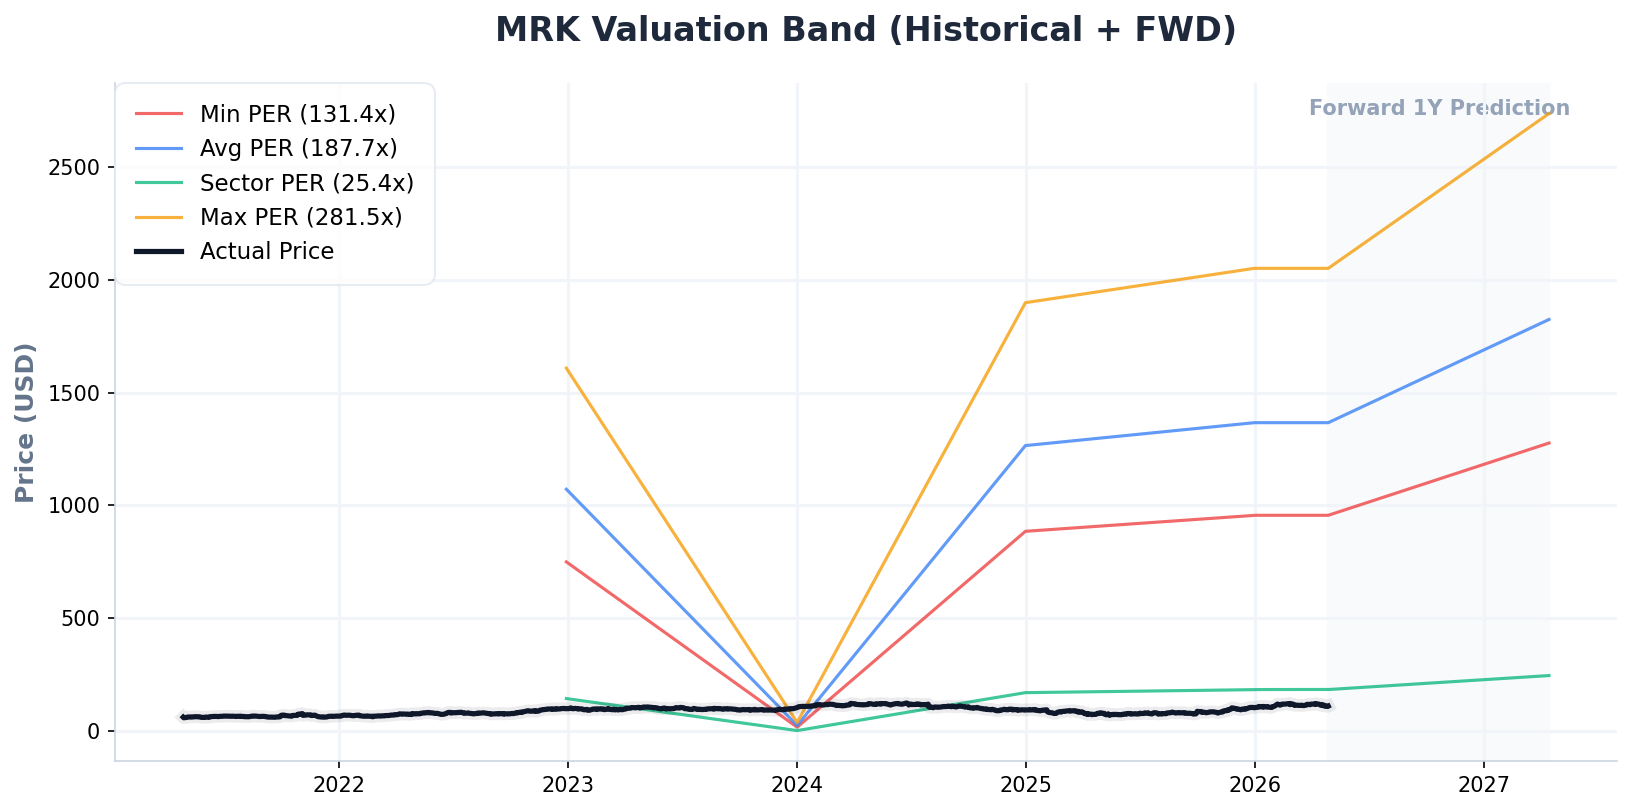
(MRK Historical 5-Year + 1-Year Forward P/E Valuation Band)
💎 C. Dividend Foundation (Dividend Data)
💡 PLAN B’s Dividend Strength Assessment
A 3.08% dividend yield is a highly attractive entry point for investors designing stable cash-flow portfolios. The 21-year consecutive dividend growth track record and a healthy payout ratio of around 45% indicate that continued dividend increases remain well within reach. The 5-year average growth rate of 6.75% makes Merck a reliable inflation-fighting asset.
📊 D. Key Fundamentals (TTM Basis)
📈 E. Earnings Momentum & Dividend Sustainability
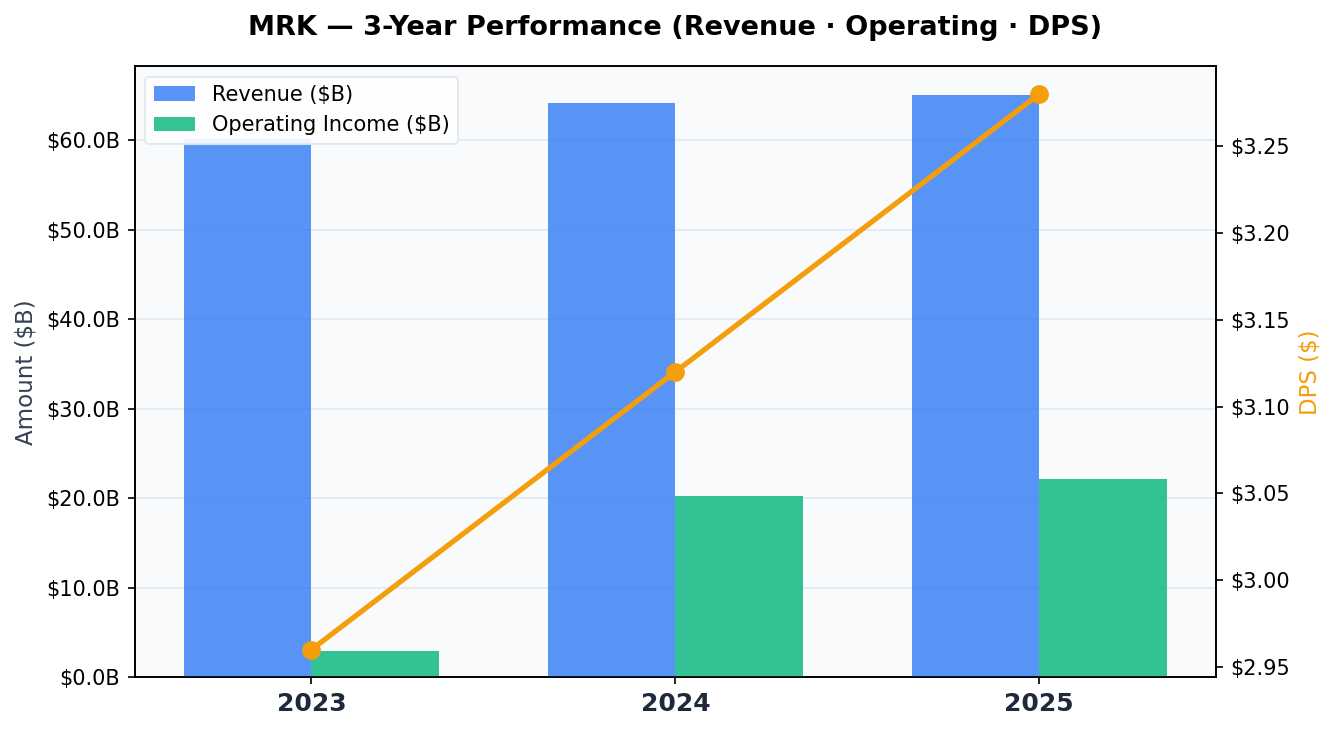
(MRK 3-Year Revenue, Operating Income & DPS Trend)
The sharp 48.78% quarter-over-quarter decline in net income is assessed as an accounting fluctuation driven by one-time M&A-related charges and expanded R&D investment — not an operational deterioration. With annual revenue of $65 billion and robust free cash flow (FCF) of $12.3 billion sustained, the company’s fundamental earnings power remains at its peak.
⚖️ F. Fair Value Calculation
🔍 6-Way Valuation Checklist
| Valuation Model | Fair Value Est. | Core Logic |
|---|---|---|
| [M1] P/E Ensemble | $203.65 | Market(28.2) / Sector(25.2) / Historical(30.5) P/E 3-Way Ensemble |
| [M2] P/FCF Cash Flow | 113.33 | Sector average P/FCF multiple applied (0.9x adjustment) |
| [M3] Dividend Yield Theory | $112.21 | Reverse-engineered from Historical Avg. Yield (3.03%) — Core Dividend Model |
| [M4] Historical P/FCF Multiple | $152.87 | Stock’s own historical P/FCF multiple applied |
| [M5] Wall Street Consensus | $129.74 | Institutional analyst 12-month price target average |
| [M6] Dynamic DCF | 74.76 | Gordon Growth Model based on free cash flow (discount rate: 7.0%, growth rate: 1.6% [Revenue CAGR]) |
📌 Sector-Specific Valuation Notes
Dynamic Winsorization was applied to one historical P/E outlier (raw historical average: 187.7x → adjusted: 30.5x, dynamic range: [10.0x, 80.0x]).
PLANB INSIGHT Deep-Dive Valuation Analysis & Adjustment Rationale
Merck’s current share price represents approximately a 26% discount to its intrinsic value of $141.8. Historical figures that could be distorted by temporary earnings anomalies were dynamically adjusted within the stock’s own historical range using a statistical correction technique (Winsorization*), improving the reliability of the fair value estimate. The current price zone represents a ‘Strong Buy’ area with a sufficient margin of safety — an optimal entry point to capture both the stability and income potential of a long-term dividend portfolio. (*Winsorization: a technique that corrects values falling outside a statistical range to the upper or lower boundary of that range, preventing extreme outliers from distorting the overall average.)
⚠️ This post is a personal investment study and does not constitute investment advice or a recommendation to buy or sell any security.
All investment decisions and their consequences are solely the responsibility of the individual investor. Please conduct thorough due diligence and consult a professional before investing.