
Accenture (ACN) Dividend Investment Analysis
Dividend Growth Analysis | Accenture (ACN): Harmonizing 15 Years of Consecutive Dividend Growth and AI Booking Explosion Potential
🏢 A. Business Overview (What They Do)
Accenture plc is a leading global professional services company providing a broad range of services and solutions in strategy, consulting, digital, technology, and operations. With a strong focus on innovation and technology, Accenture helps clients improve their performance and create sustainable value for their stakeholders. The company is actively expanding its capabilities in artificial intelligence (AI), evidenced by significant AI-related bookings and strategic partnerships.
📉 B. Price Trend & Key Metrics
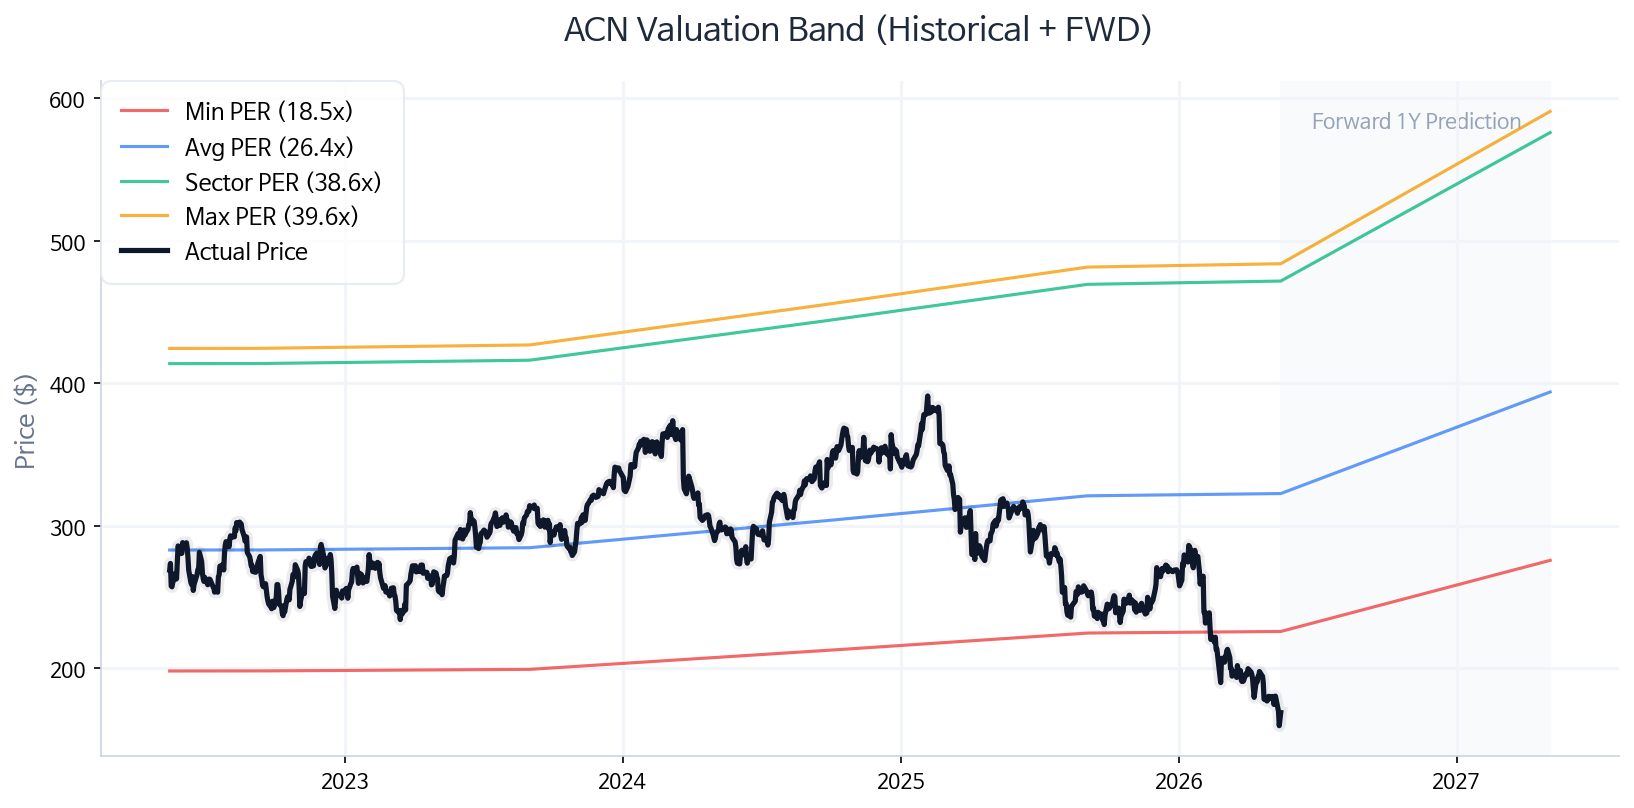
(ACN Historical 5-Year + 1-Year Forward P/E Valuation Band)
💎 C. Dividend Foundation (Dividend Data)
💡 PLAN B’s Dividend Strength Assessment
Accenture has demonstrated a strong commitment to shareholder returns, boasting 15 consecutive years of dividend growth, starting from 2010. This consistent performance underscores the company’s financial stability and disciplined capital allocation.
📊 D. Key Fundamentals (TTM Basis)
📈 E. Earnings Momentum & Dividend Sustainability
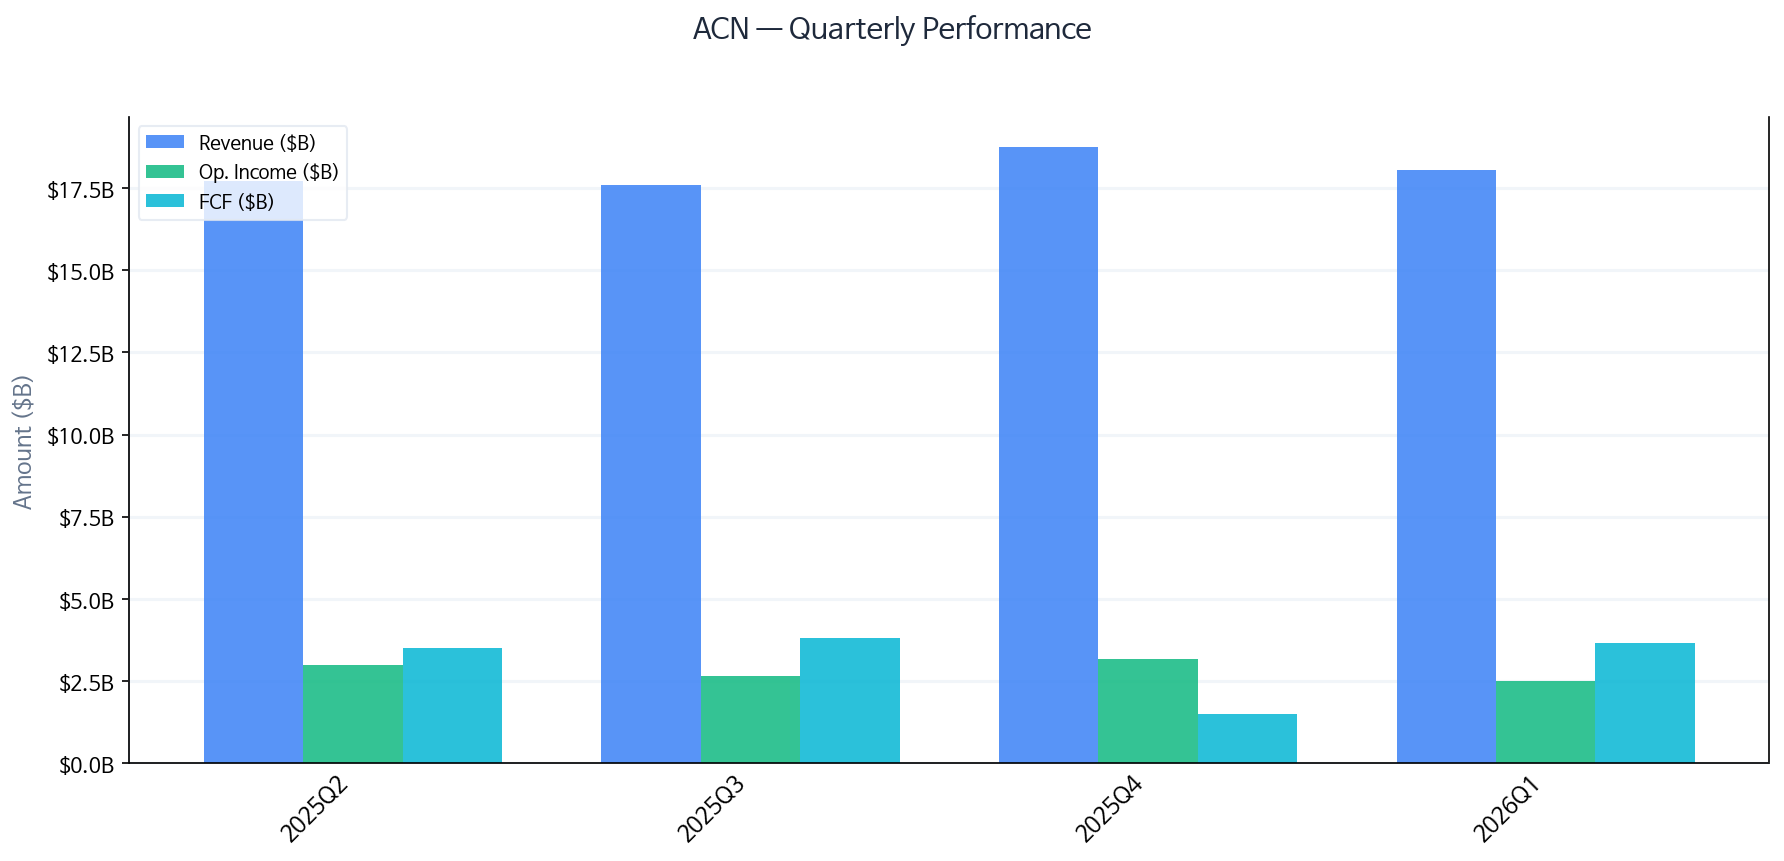
(ACN 3-Year Revenue, Operating Income & DPS Trend)
Accenture is experiencing robust momentum in its AI initiatives, highlighted by over $5.9~7billion in GenAI bookings. Strategic partnerships with key industry players like NVIDIA and Microsoft further solidify its position at the forefront of AI adoption and transformation, indicating strong future growth prospects.
⚖️ F. Fair Value Calculation
🔍 6-Way Valuation Checklist
| Valuation Model | Fair Value Est. | Core Logic |
|---|---|---|
| [M1] P/E Ensemble | $377.73 | Market(27.8) / Sector(38.6) / Historical(26.4) P/E 3-Way Ensemble |
| [M2] P/FCF Cash Flow | $707.61 | Sector avg. P/FCF multiple applied (0.9x haircut) |
| [M3] Dividend Yield Theory | $407.50 | Reverse-engineered from Historical Avg. Yield (1.6%) — Core Dividend Model |
| [M4] Historical P/FCF Multiple | $537.67 | Stock-specific historical P/FCF multiple applied |
| [M5] Wall Street Consensus | $249.19 | Institutional analyst 12-month price target average |
| [M6] Dynamic DCF | $208.93 | Cash flow-based Gordon Growth Model (Discount Rate: 9.9%, Growth Rate: 2.0% [Earnings Growth]) |
PLANB INSIGHT Deep-Dive Valuation Analysis & Adjustment Rationale
While concerns such as ambiguity in market positioning, reduction in U.S. federal government contracts, and disappointing forward guidance have led to a price correction, these risks appear excessively priced in. Even if some concerns materialize, the current valuation presents a rare opportunity to acquire a high-quality dividend growth stock at a significant discount.
⚠️ This post is a personal investment study and does not constitute investment advice or a recommendation to buy or sell any security.
All investment decisions and their consequences are solely the responsibility of the individual investor. Please conduct thorough due diligence and consult a professional before investing.