
Johnson & Johnson (JNJ) Dividend Investment Analysis
The king of healthcare and a Dividend King for 63 years, with strong momentum in pharmaceuticals led by ‘Darzalex’.
🏢 A. Business Overview (What They Do)
Since the spin-off of its consumer health division (Kenvue), Johnson & Johnson has restructured into a high-margin business focused on pharmaceuticals and MedTech. Its oncology portfolio, including Darzalex and Erleada, continues to drive strong growth, solidifying its leadership in healthcare with recent quarterly results exceeding expectations.
📉 B. Price Trend & Key Metrics
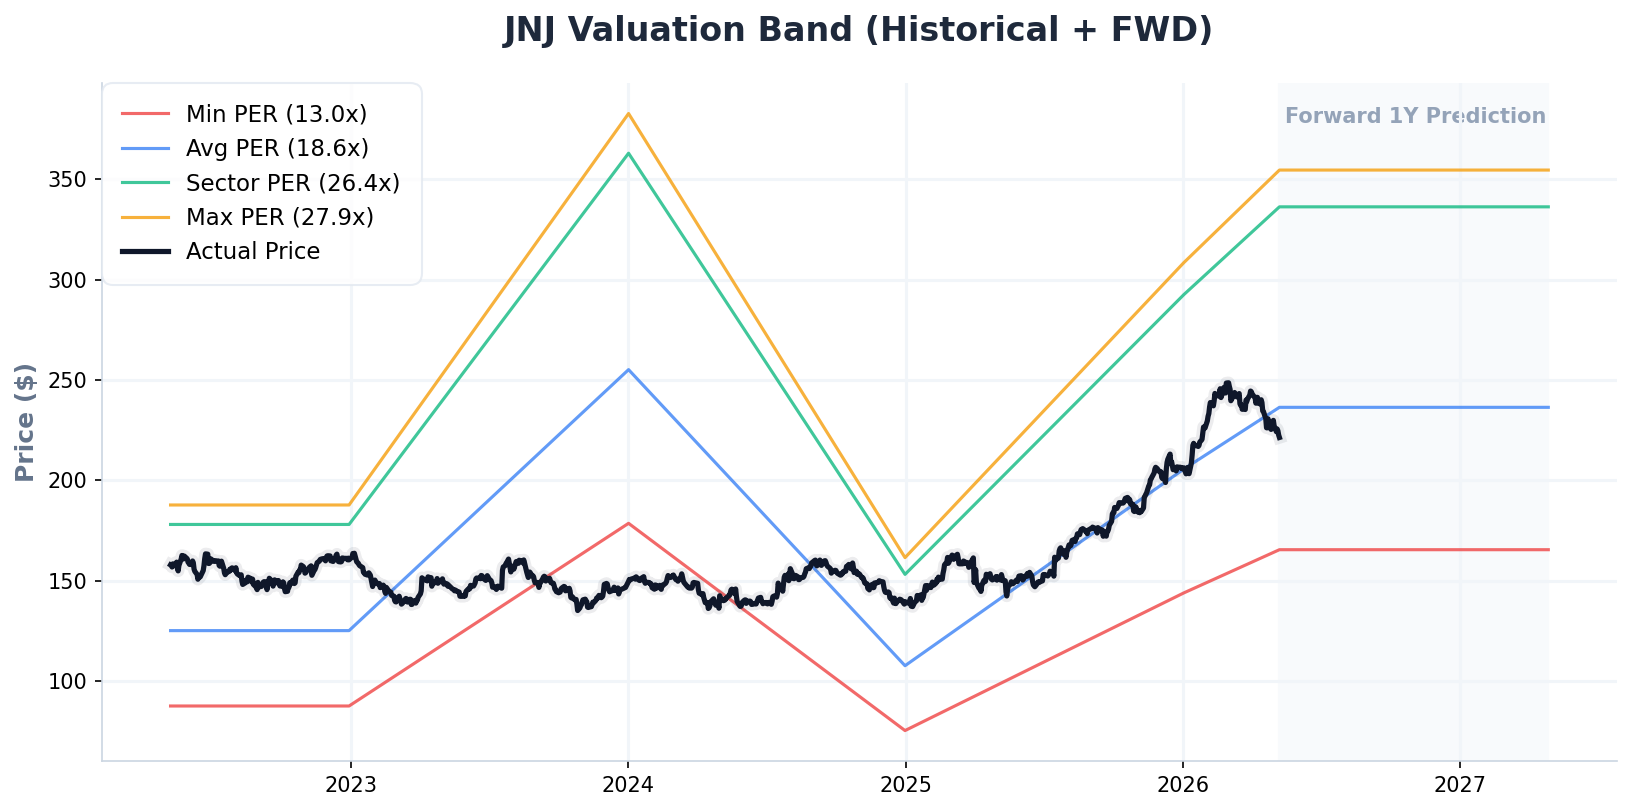
(JNJ Historical 5-Year + 1-Year Forward P/E Valuation Band)
💎 C. Dividend Foundation (Dividend Data)
💡 PLAN B’s Dividend Strength Assessment
JNJ is a legendary Dividend King with 63 consecutive years of dividend increases. Its 5-year average dividend growth rate is a stable 5.25%, and a 60.25% payout ratio suggests the dividend remains healthy. Although the FCF payout ratio is temporarily elevated due to one-time costs, long-term dividend safety is not expected to be compromised.
📊 D. Key Fundamentals (TTM Basis)
📈 E. Earnings Momentum & Dividend Sustainability
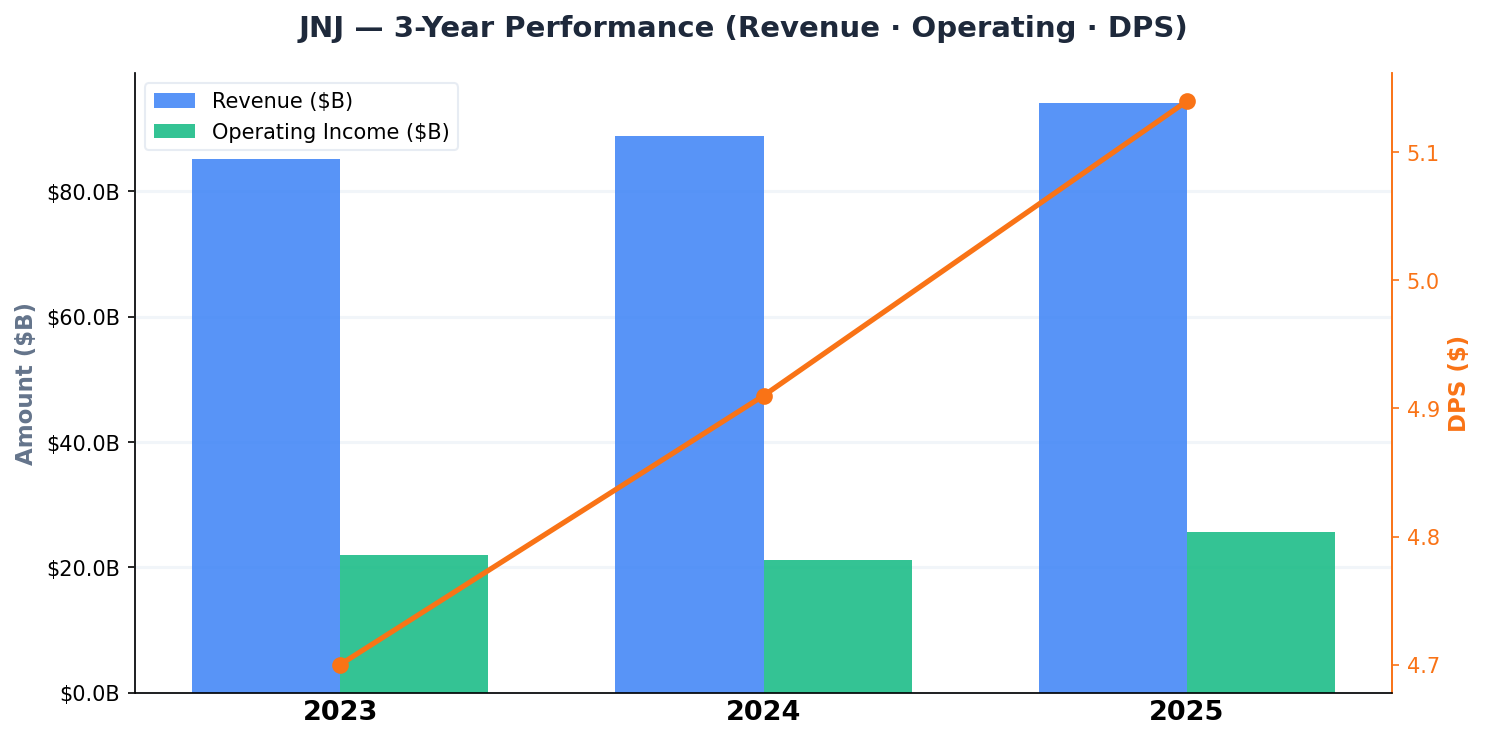
(JNJ 3-Year Revenue, Operating Income & DPS Trend)
While TTM EPS ($8.63) recently dropped 32% compared to Forward EPS ($12.71), this is attributed to one-time noise such as litigation settlements. Excluding this, revenue growth in the oncology segment remains strong, and a normalization of earnings based on Forward EPS is expected going forward.
⚖️ F. Fair Value Calculation
🔍 6-Way Valuation Checklist
| Valuation Model | Fair Value Est. | Core Logic |
|---|---|---|
| [M1] P/E Ensemble | $308.18 | Market(27.7) / Sector(26.4) / Historical(18.6) P/E 3-Way Ensemble |
| [M2] P/FCF Cash Flow | 172.2 | Sector avg. P/FCF multiple applied (0.9x haircut) |
| [M3] Dividend Yield Theory | $193.5 | Reverse-engineered from Historical Avg. Yield (2.77%) — Core Dividend Model |
| [M4] Historical P/FCF Multiple | $134.5 | Stock-specific historical P/FCF multiple applied |
| [M5] Wall Street Consensus | $252.42 | Institutional analyst 12-month price target average |
| [M6] Dynamic DCF | 141.63 | Cash flow-based Gordon Growth Model (Discount Rate: 7.0%, Growth Rate: 2.8% [Revenue CAGR]) |
📌 Sector-Specific Valuation Notes
TTM EPS(8.63) dropped 30%+ vs Forward EPS(12.71) — treated as one-time noise; M1 valuation applied using Forward EPS(12.71)
PLANB INSIGHT Deep-Dive Valuation Analysis & Adjustment Rationale
The final fair value of $200.4 is the average of valid models, including M1 (PER Ensemble $308.18), M3 (Dividend Discount $193.5), and M6 (Gordon Growth $141.63). The current price ($221.32) is overvalued by more than 9% relative to the fair value, leading to a ‘Hold’ rating. The discrepancy between valuation models stems from the conservative approach of cash flow models (M2, M4, M6) due to one-time costs; I will keep monitoring to confirm earnings normalization.
⚠️ This post is a personal investment study and does not constitute investment advice or a recommendation to buy or sell any security.
All investment decisions and their consequences are solely the responsibility of the individual investor. Please conduct thorough due diligence and consult a professional before investing.